Federal Taxes
The proposed change in tax policy by the republican congress is currently short on details. I was surprised by how much benefit they are looking to provide to a small sliver of Americans at the expense of everyone else. The IRS provides statistics on tax returns so citizens and journalists can verify claims made by all sides. The latest tax year currently available were for 2015.let me take you through a few summary views that hopefully put this in some more useful context. The graph and table below shows you the percentage of returns by income level and what % of total income is generated in those income bands. (I collapsed the income bands for under 100k and for 1 million to 10 million - you can expand to see the details by hovering over the axis where the values are and clicking on the+ button)
For example:
51% of the returns are for income less than 100k and this represented about 16% of all taxable income in 2015. (21 million plus returns)
at the other end of the spectrum
.04% of returns (17 thousand returns) were for people making more than 10 million dollars in 2015 and that was responsible for about 9% of taxable income.
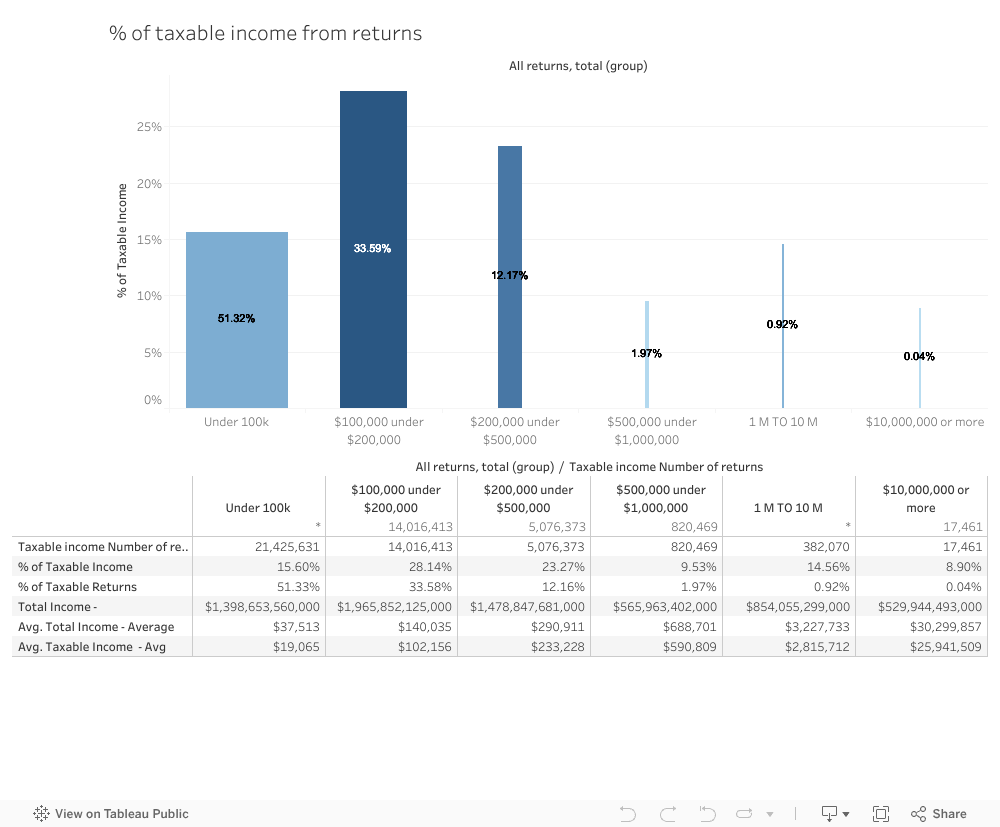
In other words 17 thousand returns (families) generated almost half the income as 21 million families

No comments:
Post a Comment